
IPCC Report about global warming: My 6 take aways
On August 9 2021, IPCC (Intergovernmental Panel on Climate Change) released their newest report about climate science and climate change, summarising several reports of different working groups and with the help of more than 200 global scientists. IPCC is the international body for assessing the science related to climate change. The IPCC was set up in 1988 by the World Meteorological Organization (WMO) and United Nations Environment Programme (UNEP) to provide policymakers with regular assessme

On August 9 2021, IPCC (Intergovernmental Panel on Climate Change) released their newest report about climate science and climate change, summarising several reports of different working groups and with the help of more than 200 global scientists.
IPCC is the international body for assessing the science related to climate change. The IPCC was set up in 1988 by the World Meteorological Organization (WMO) and United Nations Environment Programme (UNEP) to provide policymakers with regular assessments of the scientific basis of climate change, its impacts and future risks, and options for adaptation and mitigation.
The newest, 6th assessment, report is a fact-based list of our future. The IPCC report provides different future scenarios whether we reach greenhouse emission net zero by 2040 to limit global warming to 1.5°C or not.
The goal of the Paris Agreement of 2015, which 196 countries accepted, is to limit global warming to well below 2°C, preferably to 1.5°C, compared to pre-industrial levels. However, to reach this goal we need to reduce the greenhouse emissions way quicker than expected - by 2040 instead of 2050 to stay under 1.5 °C. We talk about less than 20 years from now. Why so quick and why is it so hard to achieve?
In the following 6 take aways, I tried to combine the key findings of the newest IPCC report with economical impact for the world, Europe and Switzerland and the necessary innovation requirements in the next 20 years.
1. Humans caused 1 degree increase in global temperature in the last 100 years.
The IPCC Report clearly links human activities with global warming of approximately 1.0°C caused by human caused geenhouse emission. Global warming is likely to reach 1.5°C between 2030 and 2052 if it continues to increase at the current rate.

Source: IPCC Report 2021
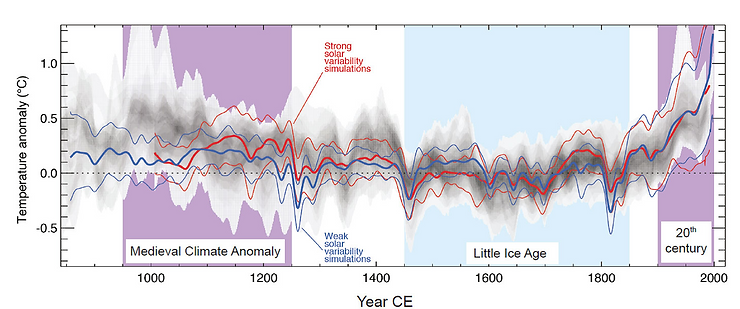
To put into longer perspective, you can look at this graphic of the past 1000 years.
Source: https://www.ncdc.noaa.gov/global-warming/last-1000-years
Looking at the relative contributions of these forcings to climate change over the past 1,000 years, scientists have concluded from model simulations that:
Solar and volcanic forcings have been responsible for some of the variations in Northern Hemisphere temperature over the past 1,000 years.
Neither solar nor volcanic forcing can explain the dramatic warming of the 20th century. Changes in these forcings during the 20th century would actually have resulted in a small cooling since 1960.
Only when adding the human-caused increase in greenhouse gas concentrations the models are able to explain the unprecedented warmth we are currently experiencing.
So how much hotter can it get?
Currently, we are emitting around 50bn tonnes of greenhouse emissions, which exists out of 40bn tonnes of CO2 and 10bn tonnes of other greenhouse gases (more later on).
Based on analysis of ice, the history shows large changes in the CO2 concentration based on the changes of the orbit to the sun which caused ice ages (low CO2) and interglacial times (high CO2) in the last 800'000 years. Theses changes occurred over thousand of years. However, it has been never that high as in the last 50 years with such a rapid increase:

https://ourworldindata.org/co2-and-other-greenhouse-gas-emissions
The greenhouse emissions are the main driver for the global warming since pre-industrial times and without reducing them to net zero, we will see the temperature increasing between 2°C and 4.8°C in the next 80 years based on our actions.

Based the IPCC’s Special Report on 1.5°C and Michael Raupach’s work, published in NatureClimate Change, these mitigation curves show that urgent and rapid reductions in emissions would be needed to achieve either target.
https://ourworldindata.org/co2-and-other-greenhouse-gas-emissions
The regions of the world will be impacted differently based on the temperature increase and precipitation increase. Notably is that the Arctic, South East Asia, India, China and South America will be most impacted in any scenario (increase by 1.5°C in comparison to 2.0°C).

Source: IPCC Report 2021
So what is the impact of rising temperatures in such a short time span?
2. Sea Levels can rise in the next 50 years up to 0.5m despite limiting the temperature to 1.5 increase.
If we continue to submit as many greenhouse emissions as now, then we will have up to 1m increase of sea level by 2100. Even if we limit the temperature to 1.5°C increase, we will still see an increase of up to 0.5m and it will continue to rise afterwards.

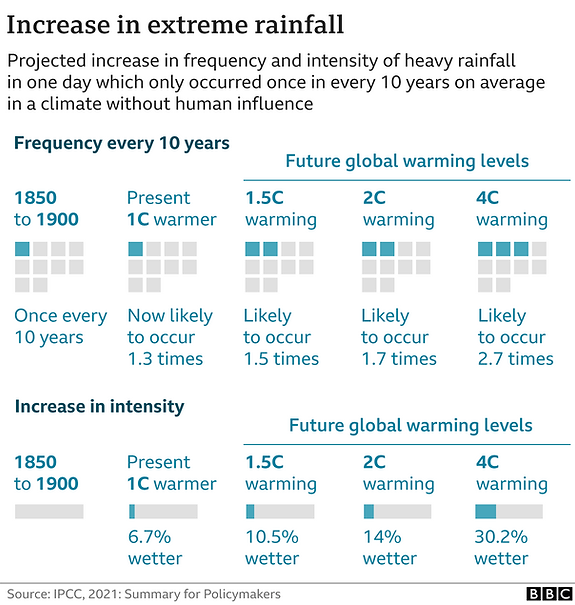
It will also rain more often and more frequent depending on the temperature increase.
NASA's Sea Level Change Team has created a sea level projection tool based on the IPCC report that visualizes the impacts of future sea level rise on coastlines and communities. More than 600 million people (around 10 percent of the world's population) live in coastal areas that are less than 10 meters (32 feet) above sea level.
The following visualization shows the impact on cities based on different sea-levels. Maybe this graphic is quite drastic with 80m sea-level rise. But we can reach 1m in the next 50 years.

3. We have experienced a decline of 68% of all living species since 1975. The temperature increase will enforce it even more.
68% of all living species declined since 1970:

Source: https://www.zsl.org/sites/default/files/LPR%202020%20Full%20report.pdf
Swiss Re Institute's BES Index reveals that over half (55%) of global GDP is dependent on biodiversity and ecosystem services. It also shows that in a fifth of all countries, ecosystems are in a fragile state for more than 30% of the entire country area.

In Europe we experience a decline of 24% of living species mainly due to changes in land use. The climate change will increase that number significantly in future.

According to IPCC Report:
Of 105,000 species studied, 6% of insects, 8% of plants and 4% of vertebrates are projected to lose over half of their climatically determined geographic range at global warming of 1.5°C, compared with 18% of insects, 16% of plants and 8% of vertebrates for global warming of 2°C (medium confidence). Impacts associated with other biodiversity-related risks such as forest fires and the spread of invasive species are lower at 1.5°C compared to 2°C of global warming (high confidence).
The Arctic ice is melting and we will see the first ice-free summer in the next 60 years with major implication on weather, fisheries and ecosystems. Coral reefs, for example, are projected to decline by a further 70–90% at 1.5°C (high confidence) with larger losses (>99%) at 2°C (very high confidence)
4. We need to reach net zero by 2040 (in 20 years), to limit the temperature rise to 1.5 degrees.
The following quite complicated graphic shows, how much greenhouse emissions we need to extract and reduce which is getting pumped into the atmosphere every year.

Source: IPCC Report 2021
Today, we release around 50bn tonnes of CO2 and non-CO2 in the atmosphere. To limit the warming to 1.5 degrees, we need to reach net zero by 2040 instead of 2050 as agreed in the Paris Agreement.
What is net zero? Put simply, net zero refers to the balance between the amount of greenhouse gas produced and the amount removed from the atmosphere.
You can reach net zero by:
lower the emissions we are sending into the atmosphere, from activities such as industrial processes, power generation, transport and intensive agriculture
remove greenhouse gas emissions from the atmosphere, for example by capturing carbon created during industrial processes before it’s released or planting more trees.
To reach net zero, we also need to remove 50bn tones of greenhouse emission out of the atmosphere and then create the balance. And we are not only taking about CO2, we also need to reduce Methan, black carbon and Nitrious oxide.
What is CO2?
Carbon dioxide (chemical formula CO2) is an acidic colorless gas with a density about 53% higher than that of dry air. Natural sources include volcanoes, hot springs and geysers, and it is freed from carbonate rocks by dissolution in water and acids. Because carbon dioxide is soluble in water, it occurs naturally in groundwater, rivers and lakes, ice caps, glaciers and seawater. It is present in deposits of petroleum and natural gas. In 2018, 89% of global CO2 emissions came from fossil fuels and industry. (IPCC Report 2018)
https://en.wikipedia.org/wiki/Carbon_dioxide

Source: https://www.epa.gov/ghgemissions/overview-greenhouse-gases
What is Methane?
Methane is an important greenhouse gas because it is such a potent heat absorber. The concentration of methane in our atmosphere has risen by about 150% since 1750, apparently largely due to human activities. Methane accounts for about 20% of the heating effects by all of the greenhouse gases combined. Both natural and human sources supply methane to Earth's atmosphere.
Major natural sources of methane include emissions from wetlands and oceans, and from the digestive processes of termites. Sources related to human activities include rice production, landfills, raising cattle and other ruminant animals (cow burps!), and energy generation.
https://scied.ucar.edu/learning-zone/how-climate-works/methane
What is black carbon?
Black Carbon (BC) has recently emerged as a major contributor to global climate change, possibly second only to CO2 as the main driver of change. BC particles strongly absorb sunlight and give soot its black color. BC is produced both naturally and by human activities as a result of the incomplete combustion of fossil fuels, biofuels, and biomass. Primary sources include emissions from diesel engines, cook stoves, wood burning and forest fires.
https://www.c2es.org/document/what-is-black-carbon/
What is Nitrious oxide?
Nitrous oxide is emitted during agricultural, land use, industrial activities, combustion of fossil fuels and solid waste, as well as during treatment of wastewater.
https://www.epa.gov/ghgemissions/overview-greenhouse-gases
Coming back to the reduction. The following graphic illustrates, that we need to start now, today in 2020, to reduce CO2 emissions to net zero by 2040 because we are already overshooting the targets since 2010. It also shows that we need to reduce the other Non-CO2 emission to actually hit the target:
- Methan and black carbon by 35%
- Nitrous oxide by 10%

This graphic assumes that the population and the demand for energy is not growing.
Based on the UN we are expecting to have 10.9bn people living on the planet by 2100.
This visualization presents this big overview of the global demographic transition – with the very latest data from the UN Population Division.
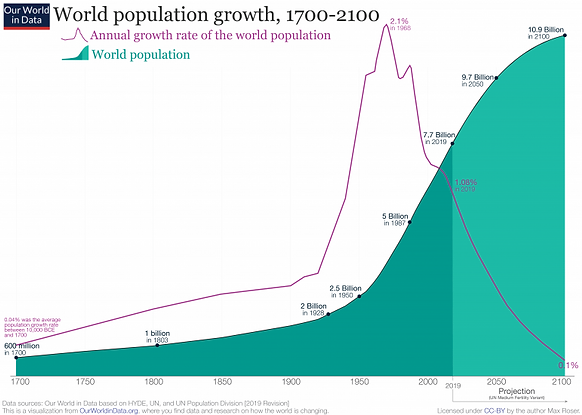
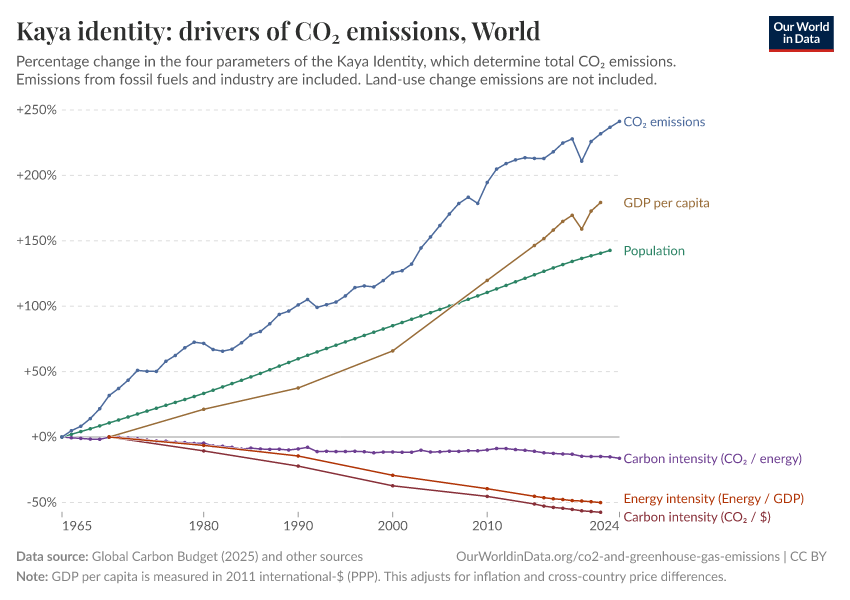
Population and GDP Development are key driver for emissions, hence we are electrifying the world while raising them out of poverty. So, the overall demand of electricity is increasing and along it the demand for fossil fuel.
Kaya identity: drivers of CO₂ emissions, World
Kaya identity: drivers of CO₂ emissions, World
Percentage change in the four parameters of the Kaya Identity, which determine total CO₂ emissions. Emissions fromfossil fuels and industry are included. Land-use change emissions are not included.
196520241980199020002010-50%+0%+50%+100%+150%+200%+250%CO₂ emissionsGDP per capitaPopulationCarbon intensity (CO₂ / energy)Energy intensity (Energy / GDP)Carbon intensity (CO₂ / $)
1965
2024
Interactive visualization requires JavaScript
Related research and data
Charts
- Adjusted net savings per capita
- Annual CO₂ emissions
- Annual CO₂ emissions by world region
- Annual CO₂ emissions from aviation
- Annual CO₂ emissions from cement
- Annual CO₂ emissions from coal
- Annual CO₂ emissions from deforestation by product
- Annual CO₂ emissions from deforestation for food production
- Annual CO₂ emissions from flaring
- Annual CO₂ emissions from gas
- Annual CO₂ emissions from land-use change
- Annual CO₂ emissions from land-use change per capita
- Annual CO₂ emissions from oil
- Annual CO₂ emissions from other industry
- Annual CO₂ emissions including land-use change
- Annual change in GDP and CO₂ emissions
- Annual change in GDP, population and CO₂ emissions
- Annual greenhouse gas emissions by world region
- Annual percentage change in CO₂ emissions
- Are consumption-based CO₂ per capita emissions above or below the global average?
- Aviation's share of global CO₂ emissions
- CO₂ emissions by fuel or industry
- CO₂ emissions by fuel or industry type
- CO₂ emissions by sector
- CO₂ emissions embedded in trade
- CO₂ emissions from domestic air travel
- CO₂ emissions from fossil fuels and land-use change Stacked area chart
- CO₂ emissions from fossil fuels and land-use change Line chart
- CO₂ emissions from international aviation
- CO₂ emissions from transport
- CO₂ emissions per capita
- CO₂ emissions per capita
- CO₂ emissions per capita vs. GDP per capita
- CO₂ emissions per capita vs. fossil fuel consumption per capita
- CO₂ emissions per capita vs. share of electricity generation from renewables
- CO₂ reductions needed to keep global temperature rise below 1.5°C
- CO₂ reductions needed to keep global temperature rise below 2°C
- Carbon dioxide emission factors
- Carbon dioxide emissions by income level
- Carbon emission intensity vs. GDP per capita
- Carbon footprint of travel per kilometer
- Carbon intensity of energy
- Carbon intensity vs. GDP per capita
- Carbon intensity: CO₂ emissions per dollar of GDP
- Carbon opportunity costs per kilogram of food
- Change in CO₂ emissions and GDP
- Change in per capita CO₂ emissions and GDP Adjusted for consumption
- Change in per capita CO₂ emissions and GDP Production-based
- Coal consumption and sulphur dioxide emissions
- Consumption-based CO₂ emissions
- Consumption-based CO₂ emissions per capita vs. GDP per capita
- Consumption-based CO₂ emissions per capita vs. Human Development Index
- Consumption-based carbon intensity
- Consumption-based vs. territorial CO₂ emissions per capita
- Contribution to global mean surface temperature rise
- Contribution to global mean surface temperature rise by gas
- Contribution to global mean surface temperature rise from agriculture and land use
- Contribution to global mean surface temperature rise from fossil sources
- Contribution to value added vs. share of CO₂ emissions in China
- Contribution to value added vs. share of CO₂ emissions in Germany
- Contribution to value added vs. share of CO₂ emissions in USA
- Countries using the System of Environmental-Economic Accounting
- Cumulative CO₂ emissions
- Cumulative CO₂ emissions by source
- Cumulative CO₂ emissions by world region
- Cumulative CO₂ emissions from cement
- Cumulative CO₂ emissions from coal
- Cumulative CO₂ emissions from flaring
- Cumulative CO₂ emissions from gas
- Cumulative CO₂ emissions from land-use change
- Cumulative CO₂ emissions from oil
- Cumulative CO₂ emissions from other industry
- Cumulative CO₂ emissions including land-use change
- Emissions-weighted carbon price from carbon taxes
- Emissions-weighted carbon price in emissions trading systems
- Energy use per capita vs. CO₂ emissions per capita
- Explicit consumption subsidies for fossil fuels
- Export of environmentally sound technologies
- Food: emissions from production and the supply chain
- Food: greenhouse gas emissions across the supply chain
- Global carbon emissions from heating and cooling
- Global emissions from food by life-cycle stage
- Global warming contributions by gas and source
- Global warming contributions from fossil fuels and land use
- Global warming potential of greenhouse gases relative to CO₂
- Global warming: Contributions to the change in global mean surface temperature
- Greenhouse gas emissions
- Greenhouse gas emissions by gas
- Greenhouse gas emissions by sector Lines
- Greenhouse gas emissions by sector Stacked areas
- Greenhouse gas emissions from food systems
- Greenhouse gas emissions from plastic by life-cycle stage
- Greenhouse gas emissions from plastics
- Greenhouse gas emissions per 100 grams of protein
- Greenhouse gas emissions per 1000 kilocalories
- Greenhouse gas emissions per kilogram of food product
- Greenhouse gas emissions per kilogram of seafood
- How have things changed?
- Hypothetical number of deaths from energy production
- Import of environmentally sound technologies
- Imported or exported CO₂ emissions per capita
- Level of implementation of sustainable procurement policies and plans
- Life expectancy at birth vs. CO₂ emissions per capita
- Life satisfaction vs. CO₂ emissions per capita
- Meat supply vs. GDP per capita
- Mechanisms in place to enhance policy coherence for sustainable development
- Methane concentration in the atmosphere
- Methane emissions
- Methane emissions by sector
- Methane emissions from agriculture
- Monthly CO₂ emissions from all commercial passenger flights
- Monthly CO₂ emissions from domestic and international commercial passenger flights
- Nitrous oxide emissions
- Nitrous oxide emissions by sector
- Nitrous oxide emissions from agriculture
- Number of companies publishing sustainability reports that meet the minimum reporting requirements
- Per capita CO₂ emissions from domestic commercial passenger flights
- Per capita CO₂ emissions by fuel type
- Per capita CO₂ emissions by region
- Per capita CO₂ emissions by sector
- Per capita CO₂ emissions by source
- Per capita CO₂ emissions from aviation
- Per capita CO₂ emissions from cement
- Per capita CO₂ emissions from coal
- Per capita CO₂ emissions from deforestation for food production
- Per capita CO₂ emissions from domestic aviation vs. GDP per capita
- Per capita CO₂ emissions from domestic aviation vs. land area
- Per capita CO₂ emissions from flaring
- Per capita CO₂ emissions from gas
- Per capita CO₂ emissions from international aviation
- Per capita CO₂ emissions from international commercial passenger flights, tourism-adjusted OECD & UNWTO
- Per capita CO₂ emissions from international passenger flights, tourism-adjusted Graver & World Bank
- Per capita CO₂ emissions from oil
- Per capita CO₂ emissions from transport
- Per capita CO₂ emissions including land-use change
- Per capita CO₂ emissions relative to the global average
- Per capita CO₂ emissions vs. per capita energy consumption
- Per capita GHG emissions vs. per capita CO₂ emissions Land use not included
- Per capita GHG emissions vs. per capita CO₂ emissions Land use included
- Per capita consumption-based CO₂ emissions
- Per capita greenhouse gas emissions
- Per capita greenhouse gas emissions by sector
- Per capita greenhouse gas emissions, excluding land use and forestry
- Per capita methane emissions
- Per capita methane emissions by sector
- Per capita nitrous oxide emissions
- Per capita nitrous oxide emissions by sector
- Per capita nitrous oxide emissions from agriculture
- Pig production: Greenhouse gas emissions vs. cost to animal welfare
- Share of CO₂ emissions covered by a carbon price
- Share of CO₂ emissions embedded in trade
- Share of children who are stunted vs. CO₂ emissions per capita
- Share of cumulative CO₂ emissions from oil
- Share of global CO₂ consumption-based emissions
- Share of global CO₂ emissions
- Share of global CO₂ emissions and population
- Share of global CO₂ emissions from cement
- Share of global CO₂ emissions from coal
- Share of global CO₂ emissions from flaring
- Share of global CO₂ emissions from gas
- Share of global CO₂ emissions from land-use change
- Share of global CO₂ emissions from oil
- Share of global CO₂ emissions including land-use change
- Share of global CO₂ emissions vs. share of population
- Share of global annual CO₂ emissions from other industry
- Share of global consumption-based CO₂ emissions and population
- Share of global consumption-based CO₂ emissions vs. share of population
- Share of global cumulative CO₂ emissions
- Share of global cumulative CO₂ emissions from burning gas
- Share of global cumulative CO₂ emissions from cement
- Share of global cumulative CO₂ emissions from coal
- Share of global cumulative CO₂ emissions from flaring
- Share of global cumulative CO₂ emissions from land-use change
- Share of global cumulative CO₂ emissions from other industry
- Share of global cumulative CO₂ emissions including land-use change
- Share of global greenhouse gas emissions
- Share of global greenhouse gas emissions from food
- Share of global methane emissions
- Share of global nitrous oxide emissions
- Share of national greenhouse gas emissions that come from food
- Share of required information submitted to international environmental agreements on hazardous waste and other chemicals
- Share that think people in their country should act to tackle climate change
- Status of net-zero carbon emissions targets
- Temperature change relative to the pre-industrial period
- Territorial and consumption-based CO₂ emissions
- Territorial vs. consumption-based CO₂ emissions per capita
- Total greenhouse gas emissions, excluding land use and forestry
- Transport's share of global greenhouse gas emissions from food
- Value added growth vs. CO₂ emissions growth in China
- Value added growth vs. CO₂ emissions growth in Germany
- Value added growth vs. CO₂ emissions growth in the USA
- Which countries have a carbon emissions trading system?
- Which countries have a carbon tax?
- Which countries have set a net-zero emissions target?
- Year-on-year change in CO₂ emissions
Our World in Data is free and accessible for everyone.
Help us do this work by making a donation.
We use essential cookies to run the site; these can’t be disabled. Other optional cookies help us understand how our site is used and improve it for everyone.
Read more in our Privacy Policy or manage preferences.
Reject optional cookiesAccept optional cookies
Keyboard Shortcuts
Chart
fToggle Faceting
lToggle Y log/linear
wToggle full-screen mode
sToggle sources modal
dToggle download modal
Map
gToggle globe view
Navigation
tToggle tab
?Toggle Help
shift+oReset to original
Selection
aSelect None
Timeline
pPlay
zLatest/Earliest/All period
Source: https://ourworldindata.org/emissions-drivers?country
What differentiates countries where CO2 emissions have greatly increased, stabilized, or fallen is whether the countries could reduce their energy and carbon intensity fast enough to offset this large increase in GDP (and increases in population). If improvements in energy or carbon intensity were slow (or in some cases non-existent), then CO2 emissions grew rapidly.
Who is submitting the most greenhouse emissions in which areas?
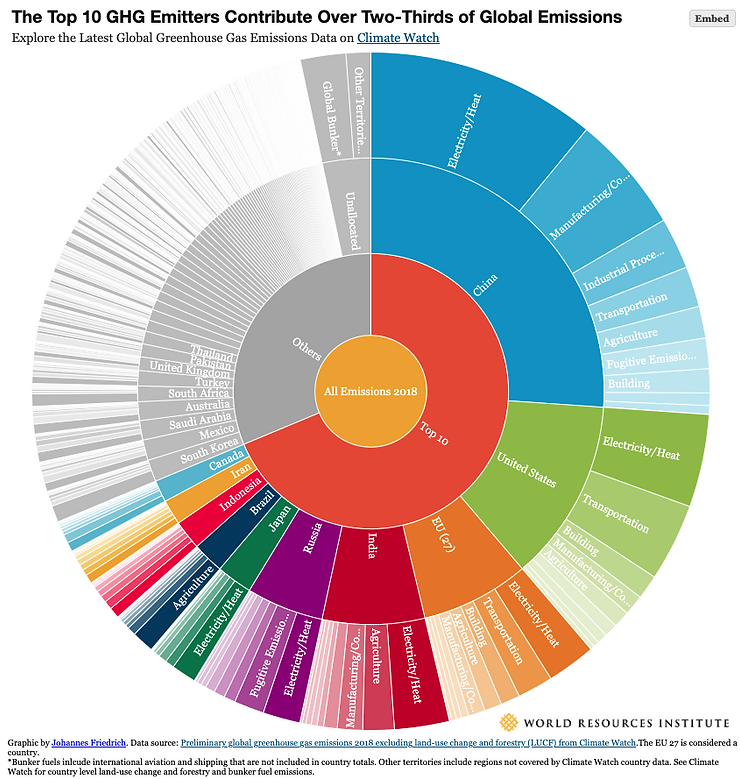
Source: https://www.climatewatchdata.org/key-visualizations?visualization=4
To give perspective - China is producing 29% of worldwide goods with US following with 17%.
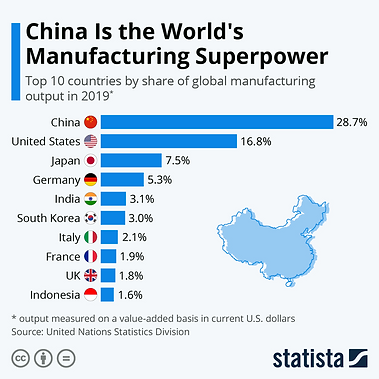
https://www.statista.com/chart/20858/top-10-countries-by-share-of-global-manufacturing-output/
Switzerland is heavily importing from Germany, Italy, US and China:

Source: This page displays a table with Switzerland Imports By Country in U.S. dollars, according to the United Nations COMTRADE database on international trade. https://tradingeconomics.com/switzerland/imports-by-country
So, it's not China's or US' problem. It is a worldwide problem to get the greenhouse emissions down because we are heavily dependant on each other. If you look at the global sector split, this is a good illustration too:
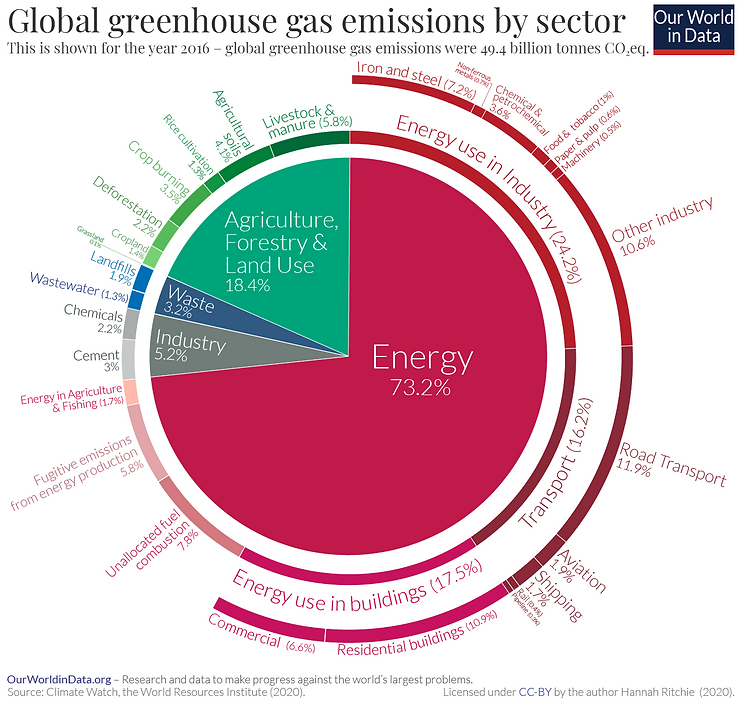
Source: https://ourworldindata.org/emissions-by-sector
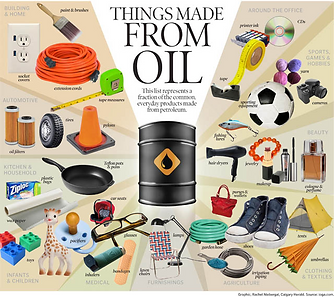
89% of all CO2 emission come from fossil fuels (coal, gas, oil) because till today it is our main source for energy, plastic and other manufacturing processes.
Oil is on our daily lives. Everywhere. This makes it so hard.
This graphic shows the increase of electricity demand which could be only met with fossil fuels.
Electricity production by source, World
Electricity production by source, World
Measured in terawatt-hours.
1985202519901995200020052010201520200 TWh5,000 TWh10,000 TWh15,000 TWh20,000 TWh25,000 TWh30,000 TWh35,000 TWhOther renewablesBioenergySolarWindHydropowerNuclearOilGasCoal
1985
2025

Interactive visualization requires JavaScript
Related research and data
- CO₂ emissions
- Electricity Mix
- Energy
- Fossil fuels are the biggest source of CO2 emissions in most countries, but there are a few exceptions
- France opened a flurry of nuclear power plants in the 1980s and 1990s, giving it low-carbon electricity ever since
- France’s nuclear fleet gives it one of the world’s lowest-carbon electricity grids
- In 2025, solar and wind produced more electricity than fossil fuels in the European Union
- Low-carbon technologies need far less mining than fossil fuels
- Renewables have taken the lead in Dutch electricity production
- War in Ukraine
- Where in the world do people emit the most CO2?
- Which countries get the most electricity from low-carbon sources?
- Why did renewables become so cheap so fast?
Charts
- Absolute annual change in primary energy consumption
- Access to clean fuels for cooking vs. per capita energy use
- Access to electricity vs. GDP per capita
- Annual change in coal energy consumption
- Annual change in fossil fuel consumption
- Annual change in gas consumption
- Annual change in hydropower generation
- Annual change in low-carbon energy generation
- Annual change in nuclear energy generation
- Annual change in oil consumption
- Annual change in primary energy consumption
- Annual change in renewable energy generation
- Annual change in solar and wind energy generation
- Annual change in solar energy generation
- Annual change in wind energy generation
- Annual patents filed for carbon capture and storage technologies
- Annual patents filed for electric vehicle technologies
- Annual patents filed for energy storage technologies
- Annual patents filed for renewable energy technologies
- Annual patents filed in sustainable energy
- Annual percentage change in coal energy consumption
- Annual percentage change in fossil fuel consumption
- Annual percentage change in gas consumption
- Annual percentage change in hydropower generation
- Annual percentage change in low-carbon energy generation
- Annual percentage change in nuclear energy generation
- Annual percentage change in oil consumption
- Annual percentage change in renewable energy generation
- Annual percentage change in solar and wind energy generation
- Annual percentage change in solar energy generation
- Annual percentage change in wind energy generation
- CO₂ emissions per capita vs. fossil fuel consumption per capita
- CO₂ emissions per capita vs. share of electricity generation from renewables
- Changes in energy use vs. changes in GDP
- Changes in energy use vs. changes in GDP per capita
- Coal by end user in the United Kingdom
- Coal energy consumption per capita vs. GDP per capita
- Coal output from opencast and deepmines in the United Kingdom
- Coal output per worker in the United Kingdom
- Coal prices
- Coal production Long-run series
- Coal production Since 1981
- Coal production and imports in the United Kingdom Tonnes
- Coal production per capita
- Coal production per capita over the long-term
- Cobalt production
- Consumption-based energy intensity per dollar
- Consumption-based energy use per person
- Countries with a sustainable consumption and production national action plan
- Crude oil prices
- Crude oil prices
- Crude oil spot prices
- Death rate from indoor air pollution vs. per capita energy use
- Death rates per unit of electricity production
- Direct primary energy consumption from fossil fuels, nuclear, and renewables
- Electric car stocks
- Electricity as a share of primary energy
- Electricity demand
- Electricity generation
- Electricity generation from coal
- Electricity generation from fossil fuels
- Electricity generation from fossil fuels, nuclear and renewables
- Electricity generation from gas
- Electricity generation from low-carbon sources
- Electricity generation from oil
- Electricity generation from renewables
- Electricity generation from solar and wind compared to coal
- Electricity production by source Line chart
- Electricity production from fossil fuels, nuclear and renewables
- Electricity production in the United Kingdom
- Employment in the coal industry in the United Kingdom
- Energy consumption by source
- Energy embedded in traded goods as a share of domestic energy
- Energy imports and exports
- Energy intensity World Bank
- Energy intensity
- Energy intensity by sector
- Energy intensity vs. GDP per capita
- Energy use per capita vs. CO₂ emissions per capita
- Energy use per person
- Energy use per person vs. GDP per capita
- Explicit consumption subsidies for fossil fuels
- Fossil fuel consumption By type
- Fossil fuel consumption By country
- Fossil fuel consumption per capita
- Fossil fuel consumption per capita by source Stacked area chart
- Fossil fuel consumption per capita by source Line chart
- Fossil fuel price index
- Fossil fuel production over the long-term
- Fossil fuel production per capita
- GDP per capita vs. energy use
- Gas consumption
- Gas consumption by region
- Gas production
- Gas production per capita
- Gas reserves
- Global aviation demand, energy efficiency and CO₂ emissions
- Global crude oil price vs. oil consumption
- Global direct primary energy consumption
- Global electricity use for air conditioning
- Global fossil fuel consumption
- Global hydropower consumption
- Global installed renewable energy capacity by technology
- Global primary energy consumption by source Line chart
- Global primary energy consumption by source Stacked area chart
- Graphite production
- How have things changed?
- Hubbert's peak prediction vs. actual oil production in the United States
- Hydropower generation
- Hydropower generation by region
- Hypothetical number of deaths from energy production
- Installed geothermal energy capacity
- Installed solar energy capacity
- Installed wind energy capacity
- Investment in renewable energy, by technology
- Kaya identity: drivers of CO₂ emissions
- Levelized cost of energy for renewables
- Lifecycle carbon intensity of electricity
- Lithium production
- Lithium-ion battery cell prices by chemistry
- Long-term energy transitions
- Low-carbon electricity generation per capita
- Low-carbon energy consumption
- Mining requirements of electricity sources, including gas
- Natural gas prices
- Natural gas production by region
- Net electricity imports
- Net electricity imports as a share of electricity demand
- Net energy embedded in traded goods
- Nuclear power generation
- Number of fully battery-electric and plug-in hybrid cars sold
- Number of new cars sold, by type
- Number of new electric cars sold
- Number of people with and without electricity access
- Number of people without access to electricity By world region
- Number of people without access to electricity By country
- Oil consumption
- Oil consumption by region
- Oil production
- Oil production by region
- Oil production per capita
- Oil rents as a share of GDP
- Oil reserves
- People without clean fuels for cooking, by world region
- Per capita CO₂ emissions by source
- Per capita CO₂ emissions vs. per capita energy consumption
- Per capita consumption of low-carbon energy
- Per capita consumption of low-carbon energy vs. GDP per capita
- Per capita electricity demand
- Per capita electricity generation
- Per capita electricity generation by source
- Per capita electricity generation from coal
- Per capita electricity generation from fossil fuels
- Per capita electricity generation from fossil fuels, nuclear and renewables
- Per capita electricity generation from gas
- Per capita electricity generation from hydropower
- Per capita electricity generation from nuclear
- Per capita electricity generation from oil
- Per capita electricity generation from renewables
- Per capita electricity generation from solar
- Per capita electricity generation from solar and wind
- Per capita electricity generation from wind
- Per capita electricity generation vs. GDP per capita
- Per capita energy consumption from coal
- Per capita energy consumption from hydropower
- Per capita energy consumption from nuclear
- Per capita energy consumption from renewables
- Per capita energy consumption from solar
- Per capita energy consumption from solar and wind
- Per capita energy consumption from wind
- Per capita energy from fossil fuels, nuclear and renewables
- Per capita fossil energy consumption vs. GDP per capita
- Per capita gas consumption
- Per capita oil consumption
- Per capita primary energy consumption by source
- Power outages in firms in a typical month
- Prices of key materials for the energy transition
- Primary direct energy consumption by source
- Primary energy consumption
- Primary energy consumption by source Over time
- Primary energy consumption by source By country
- Primary energy consumption by world region
- Primary energy consumption from fossil fuels, nuclear and renewables
- Primary energy consumption from hydropower
- Primary energy consumption from nuclear
- Primary energy consumption from renewables
- Primary energy consumption from solar
- Primary energy consumption from solar and wind
- Primary energy consumption from wind
- Production vs. consumption-based carbon intensity of energy
- Production- vs. consumption-based energy use per person
- Production-based vs. consumption-based energy use
- Renewable and nuclear energy: direct vs. substituted energy
- Renewable electricity generation Stacked area chart
- Renewable electricity generation by source
- Renewable energy consumption
- Renewable energy generation Line chart
- Renewable energy investment
- Share of cars currently in use that are electric
- Share of direct primary energy consumption by source
- Share of electricity generated by bioenergy
- Share of electricity generated by low-carbon sources
- Share of electricity generation from fossil fuels, renewables and nuclear
- Share of electricity production by source Individual sources
- Share of electricity production by source Faceted
- Share of electricity production from coal
- Share of electricity production from fossil fuels
- Share of electricity production from gas
- Share of electricity production from hydropower
- Share of electricity production from nuclear
- Share of electricity production from oil
- Share of electricity production from renewable sources
- Share of electricity production from renewables
- Share of electricity production from solar
- Share of electricity production from solar and wind
- Share of electricity production from wind
- Share of energy consumption by source
- Share of final energy use that comes from renewable sources
- Share of global primary energy consumption by source
- Share of new cars sold that are battery-electric and plug-in hybrid
- Share of new cars sold that are battery-electric and plug-in hybrid
- Share of new cars sold that are electric
- Share of new electric cars that are fully battery-electric
- Share of primary energy consumption from coal
- Share of primary energy consumption from fossil fuels
- Share of primary energy consumption from gas
- Share of primary energy consumption from hydroelectric power
- Share of primary energy consumption from low-carbon sources
- Share of primary energy consumption from nuclear
- Share of primary energy consumption from oil
- Share of primary energy consumption from renewable sources
- Share of primary energy consumption from solar
- Share of primary energy consumption from solar and wind
- Share of primary energy consumption from wind
- Share of primary energy consumption that comes from nuclear and renewables
- Share of primary energy that is low-carbon vs. GDP per capita
- Share of rural vs. urban population with electricity access
- Share of schools with access to electricity
- Share of the population with access to basic services
- Share of the population with access to electricity
- Share of the workforce employed in the coal industry, United Kingdom
- Share of total energy used in agriculture and forestry
- Share with access to electricity vs. per capita energy consumption
- Solar (photovoltaic) panels cumulative capacity
- Solar and wind power generation
- Solar energy generation by region
- Solar energy generation vs. capacity
- Solar photovoltaic module prices vs. cumulative capacity
- Solar photovoltaic panel prices
- Solar power generation
- The cost of 66 different technologies over time
- The long-term energy transition in Europe
- Thermal efficiency factor applied to non-fossil energy sources to convert them to primary energy equivalents
- When will countries phase out coal power?
- Wind energy generation by region
- Wind energy generation vs. installed capacity
- Wind power generation
- Year-to-year change in primary energy consumption by source
- Year-to-year change in primary energy consumption from fossil fuels vs. low-carbon energy
- Year-to-year percentage change in primary energy consumption
- Years of fossil fuel reserves left
Our World in Data is free and accessible for everyone.
Help us do this work by making a donation.
We use essential cookies to run the site; these can’t be disabled. Other optional cookies help us understand how our site is used and improve it for everyone.
Read more in our Privacy Policy or manage preferences.
Reject optional cookiesAccept optional cookies
Keyboard Shortcuts
Chart
fToggle Faceting
lToggle Y log/linear
wToggle full-screen mode
sToggle sources modal
dToggle download modal
Map
gToggle globe view
Navigation
tToggle tab
?Toggle Help
shift+oReset to original
Selection
aSelect None
Timeline
pPlay
zLatest/Earliest/All period
https://ourworldindata.org/worlds-energy-problem
So, if we want to tackle greenhouse emissions then we need to find a way to reduce fossil fuels as electricity source or capturing all C02 during the burning process. However, how hard this will be is shown by the raising demand of electricity in the growing developing countries which is mainly met with fossil fuels.
5. The global impact of the GDP will be -11 percent at global warming of 2 degrees.
SwissRe with partners did an extensive study regarding the global impact of temperature increase. Expected global GDP impact by 2050 under different scenarios compared to a world without climate change:
-18% if no mitigating actions are taken (3.2°C increase);-14% if some mitigating actions are taken (2.6°C increase);-11% if further mitigating actions are taken (2°C increase);-4% if Paris Agreement targets are met (below 2°C increase)
For comparison - minus 5.6% is the estimated impact of covid on the global GDP. source: https://www.statista.com/topics/6139/covid-19-impact-on-the-global-economy/
This might look like a simple model calculation and of course innovation and adaptability of human kind always surprises and might change the outcome. However, such an immediate threat to our economy would be treated very differently, if it would happen as sudden as Covid 19 instead of a long-term effect as global warming.
SwissRE provides a simplification of the the GDP impact at each country with a ranking:

"Economies in south and southeast Asia are most vulnerable to the physical risks associated with climate change. They are also the countries that have most to gain if the world is able to rein in temperature increases. Many advanced economies in the northern hemisphere are less vulnerable, being both less exposed to adverse developments in weather patterns associated with climate change, and better resourced to cope."
So, if you are in Switzerland (which is green), why should you care? Because even, if the other countries are more affected in the climate change than us. We will see the following personal impact:
Price increase of products (food, goods, etc. ) due to scarcity of resources (less habitat, more flooding, less fish combined with increase of population) - Switzerland has to import 276bn USD in goods and food to survive.
More migration and refugees of higher affected area which leads to more global crises
Stronger imbalance between countries / rich and poor leading to security issues
Swiss Companies with global presence will suffer under global crises and will have to reduce costs / employees
Even if in the short-term the temperature increase is beneficial for growing plants in Switzerland, the long-term affect are also negative for Switzerland (Association of Farmers in Switzerland reported):
Nonetheless, the negative effects dominate in the long term. The changes bring with them various challenges in cultivation. Crops such as potatoes, which were previously problem-free, will have to be increasingly watered in the future. Mild winters are bad for winter crops, which rely on sufficiently long cold spells for their optimal development. Pests can also develop better. Increased bottlenecks in the roughage supply in dry summers are to be expected. The increase in late frosts also increases the production risk.
https://www.sbv-usp.ch/fileadmin/sbvuspch/04_Medien/Medienmitteilungen/PM_2019/FOKUS03_DE_web.pdf
6. So what can we do? We need to accelerate change on different levels.
What drives, and ultimately determines levels of greenhouse emissions – whether at global; regional; national or local levels?
Total CO2 emissions are driven by four fundamental factors, outlined in the well-known equation: the ‘ Kaya Identity‘. The breakdown of the Kaya Identity equation is shown in the graphic here.
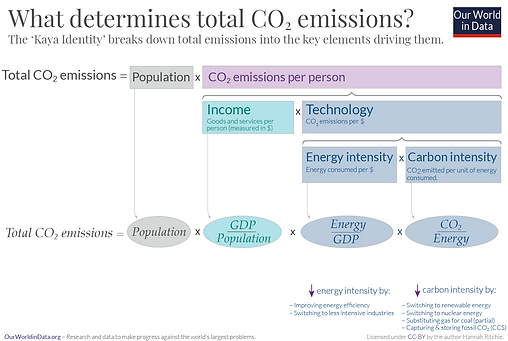
Total emissions, in the simplest description, are determined by:
Population: number of people
Per capita impact: average emissions per person
Per capita emissions are determined by:
Income: GDP per capita – richer people tend to emit more CO2
- Technology: how much CO2 is emitted per dollar spent
‘Technology’ is determined by two factors:
Energy intensity: the amount of energy consumed per unit of GDP
Carbon intensity: the amount of CO2 emitter per unit of energy
This means that total emissions are driven by the equation as stated in the graphic.
So what needs to change?
System changes in policies, laws and political behavior by integrating manufacturing and retail companies, infrastructure (energy, transportation, etc.) and agriculture to develop new global standards and to define common measures (more than just the Paris Agreement).
Create incentives (positive and negative in form of tax) for lowering risk, increasing innovation and creating a market demand for new products.
Public Awareness through joined campaigns in all media formats (social media, media houses, public events, education, universities, etc.)
Heavy investments in innovations for energy efficiency and greenhouse emission capturing and storage from public and private sector.
Change in the infrastructure (sustainable land use, water management, limitation of human spread in certain areas, etc.)
Shift to sustainable energy resources (renewable won't be enough) and make this energy as cheap as possible to provide them to the developing / population growing countries.
Change into sustainable agriculture by increasing natural habitat, biodiversity management, forestation, restriction of fishing and rethinking animal based protein production.
Reduce food waste, hence still 1/3 of all produced food gets thrown away. Improving harvesting techniques, refrigeration, transport and packaging in supply chains; and reducing consumer waste can reduce emissions significantly.
Decarbonize transportation of the world hence we will in future rely heavily on transporting goods around.
About IPCC:
The Intergovernmental Panel on Climate Change (IPCC) is the international body for assessing the science related to climate change. The IPCC was set up in 1988 by the World Meteorological Organization (WMO) and United Nations Environment Programme (UNEP) to provide policymakers with regular assessments of the scientific basis of climate change, its impacts and future risks, and options for adaptation and mitigation. IPCC assessments provide a scientific basis for governments at all levels to develop climate related policies, and they underlie negotiations at the UN Climate Conference – the United Nations Framework Convention on Climate Change (UNFCCC). The assessments are policy-relevant but not policyprescriptive: they may present projections of future climate change based on different scenarios and the risks that climate change poses and discuss the implications of response options, but they do not tell policymakers what actions to take. The IPCC embodies a unique opportunity to provide rigorous and balanced scientific information to decision-makers because of its scientific and intergovernmental nature. Participation in the IPCC is open to all member countries of the WMO and United Nations. It currently has 195 members. The Panel, made up of representatives of the member states, meets in Plenary Sessions to take major decisions. The IPCC Bureau, elected by member governments, provides guidance to the Panel on the scientific and technical aspects of the Panel’s work and advises the Panel on related management and strategic issues1 . IPCC assessments are written by hundreds of leading scientists who volunteer their time and expertise as Coordinating Lead Authors and Lead Authors of the reports. They enlist hundreds of other experts as Contributing Authors to provide complementary expertise in specific areas. The authors may work with Chapter Scientists who cross-check between findings presented in different parts of the report, carry out additional fact-checking, and work on reference management among other things. Chapter Scientists are usually early career scientists.
IPPC Policymakers Paper:
SR15_SPM_version_stand_alone_HR.pdf
Download PDF • 3.45MB


Comments
Write a comment...Write a comment...
Wix Comments
0 comments

Leave a message...
Please enter your comment
Use the right and left keyboard keys to set your rating
← All episodes